
Coordinate Geometry
Cartesian System
If we take two number lines, one horizontal and one vertical, and then combine them in such a way that they intersect each other at their zeroes, and then they form a Cartesian Plane.

- The horizontal line is known as the x-axis and the vertical line is known as the y-axis.
- The point where these two lines intersects each other is called the origin. It is represented as ‘O’.
- OX and OY are the positive directions as the positive numbers lie in the right and upward direction.
- Similarly, the left and the downward directions are the negative directions as all the negative numbers lie there.
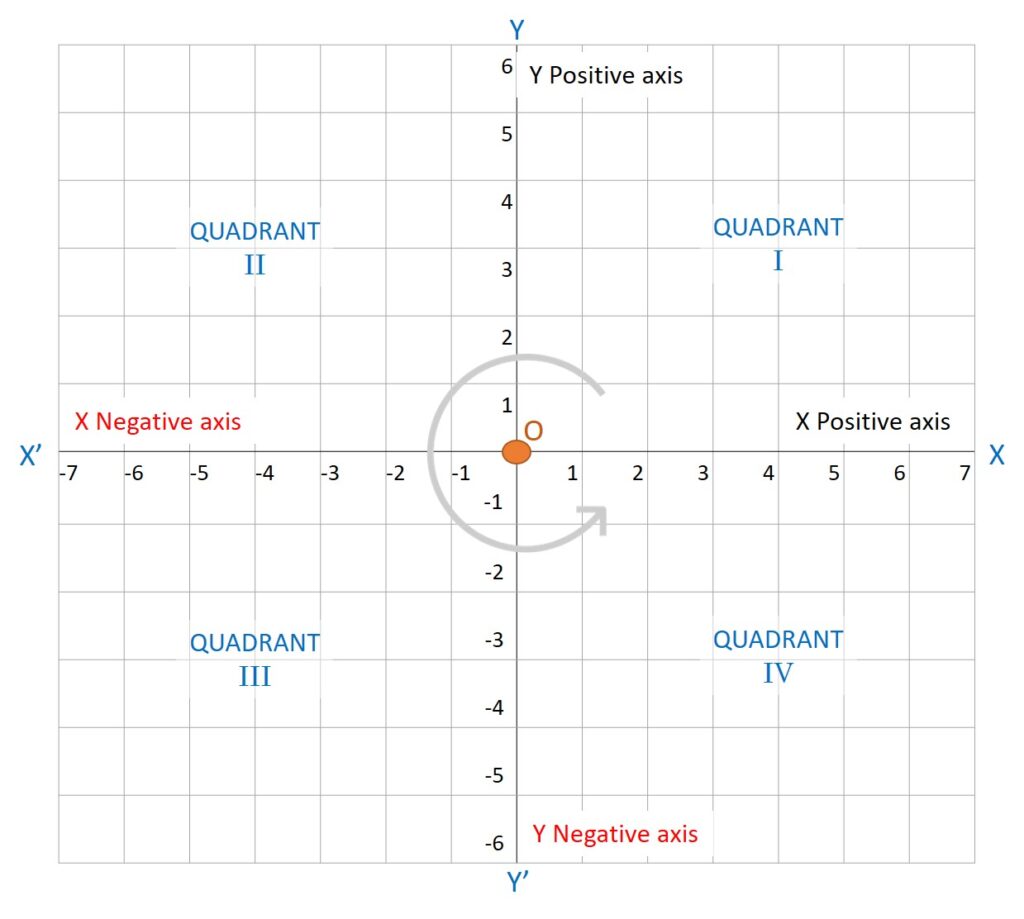
Quadrants of the Cartesian Plane
The Cartesian plane is dividing into four quadrants named as Quadrant I, II, III, and IV anticlockwise, starting from OX.
Coordinates of a Point
To write the coordinates of a point we need to follow these rules-
- The x – coordinate of a point is marked by drawing perpendicular from the y-axis measured a length of the x-axis . It is also called the Abscissa.
- The y – coordinate of a point is marked by drawing a perpendicular from the x-axis measured a length of the y-axis. It is also called the Ordinate.
- While writing the coordinates of a point in the coordinate plane, the x – coordinate comes first, and then the y – coordinate. We write the coordinates in brackets.
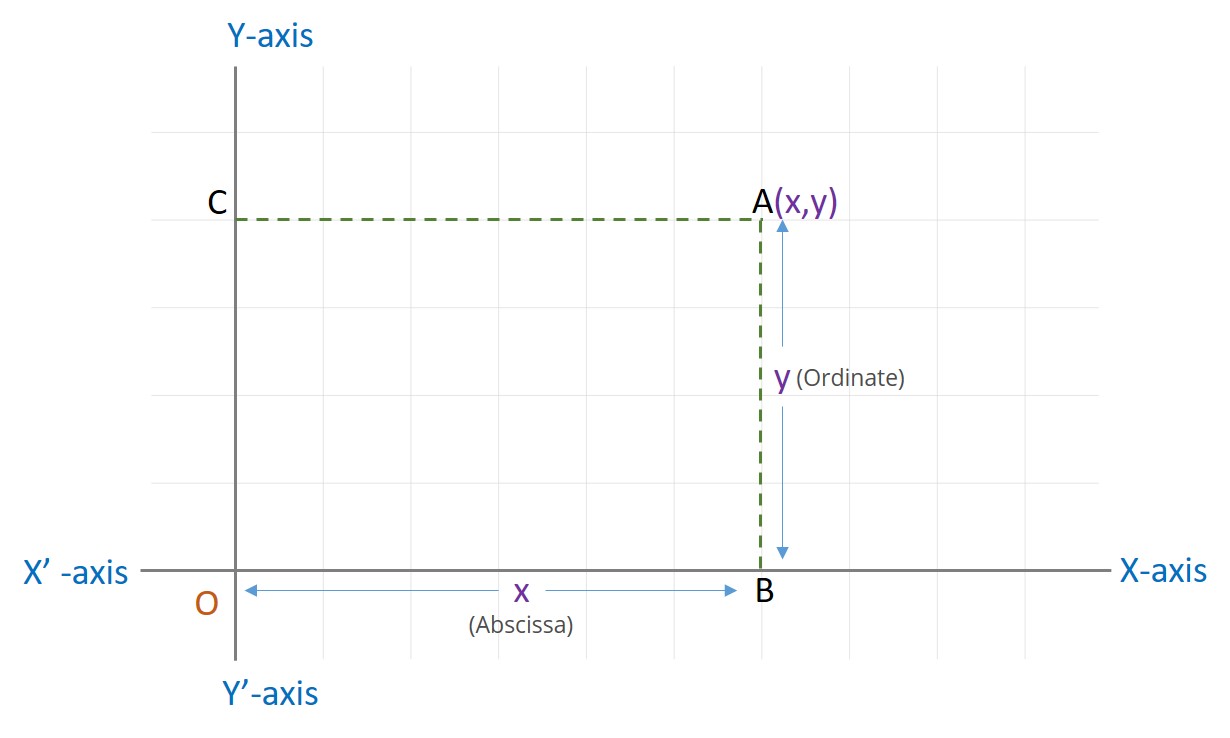
In the above figure, OB = CA = x coordinate (Abscissa), and CO = AB = y coordinate (Ordinate).
We write the coordinate as (x, y).
Remark: As the origin O has zero distance from the x-axis and the y-axis so its abscissa and ordinate are zero. Hence the coordinate of the origin is (0, 0).
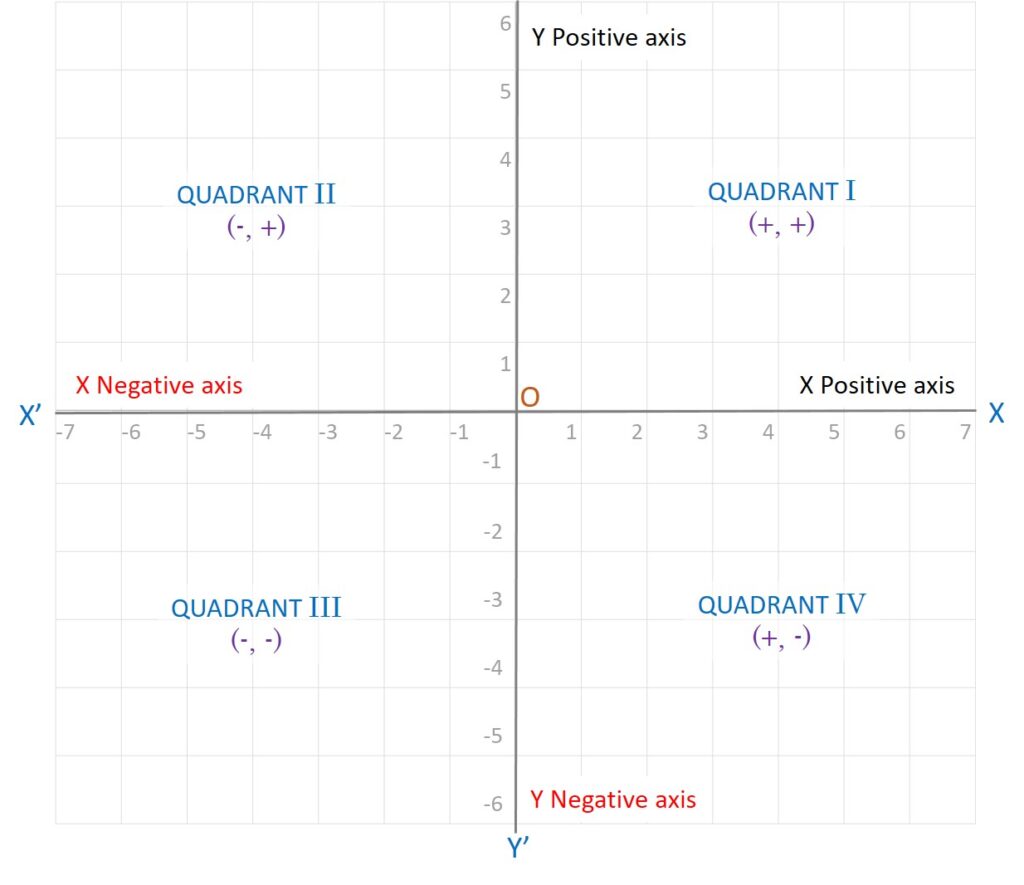
The relationship between the signs of the coordinates of a point and the quadrant of a point in which it lies.
| Quadrant | Co-ordinates | Sign in the quadrant |
|---|---|---|
| I | (+, +) | 1st quadrant is enclosed by the positive x-axis and the positive y-axis |
| II | (-, +) | 2nd quadrant is enclosed by the negative x-axis and the positive y-axis |
| III | (-, -) | 3rd quadrant is enclosed by the negative x-axis and the negative y-axis. |
| IV | (+, -) | 4th quadrant is enclosed by the positive x-axis and the negative y-axis |
Plotting a Point in the Plane if its Coordinates are Given
Steps to plot the point (2, 3) on the Cartesian plane
- First of all, we need to draw the Cartesian plane by drawing the coordinate axes with 1 unit = 1 cm.
- To mark the x coordinates, starting from 0 moves towards the positive x-axis and count to 2.
- To mark the y coordinate, starting from 2 moves upwards in the positive direction and count to 3.
- Now this point is the coordinate (2, 3)
Likewise, we can plot all the other points, like (-3, 1) and (-1.5,-2.5) in the figure.

Is the coordinates (x, y) = (y, x)?
Let x = (-4) and y = (-2)
So (x, y) = (- 4, – 2)
(y, x) = (- 2, – 4)
Let’s mark these coordinates on the Cartesian plane.
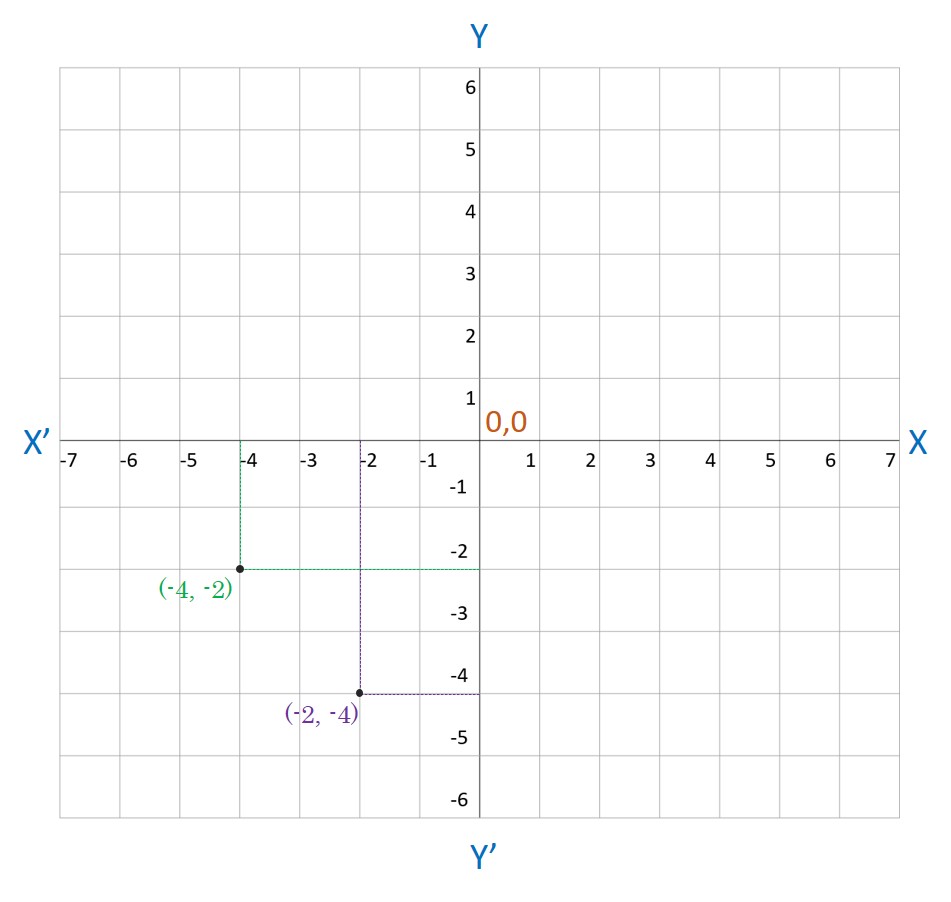
You can see that the positions of both the points are different in the Cartesian plane. So,
If x ≠ y, then (x, y) ≠ (y, x), and (x, y) = (y, x), if x = y.
Example:
Plot the points (6, 4), (- 6,- 4), (- 6, 4) and (6,- 4) on the Cartesian plane.
Solution:
As you can see in (6, 4) both the numbers are positive so it will come in the first quadrant.
For x coordinate, we will move towards the right and count to 6.
Then from that point go upward and count to 4. Mark that point as the coordinate (6, 4).

How will you describe the position of a table lamp on your study table to another person?
Example 3.1.a:
Solution:
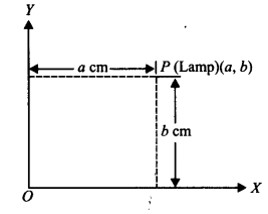
To describe the position of a table lamp placed on the table, let us consider the table lamp as P and the table as a plane.
Now choose two perpendicular edges of the table as the axes OX and OY.
Measure the perpendicular distance ‘a’cm of P (lamp) from OY. Measure the perpendicular distance ‘b’ cm of P (lamp) from OX.
Thus, the position of the table lamp P is described by the ordered pair (a, b).
Example 3.1.b:
(Street Plan): A city has two main roads which cross each other at the centre of the city. These two roads are along the North-South direction and East-West direction. All other streets of the city run parallel to these roads and are 200 m apart. There are 5 streets in each direction. Using 1 cm = 200 m, draw a model of the city on your notebook. Represent the roads/streets by single lines.
There are many cross-streets in your model. A particular cross-street is made by two streets, one running in the North-South direction and another in the East-West direction. Each cross street is referred to in the following manner: If the 2nd street running in the North-South direction and 5th in the East-West direction meet at some crossing, then we will call this cross-street (2,5). Using this convention, find:
(i) how many cross-streets can be referred to as (4,3).
(ii) how many cross-streets can be referred to as (3,4).
Solution:
(i) A unique cross street as shown by the point A(4, 3).
(ii) A unique cross street as shown by the point B(3,4).
The two cross streets are uniquely found because of the two reference lines we have used for locating them.

Example 3.2.a:
1. Write the answer of each of the following questions:
(i) What is the name of horizontal and the vertical lines drawn to determine the position of any point in the Cartesian plane?
(ii) What is the name of each part of the plane formed by these two lines?
(iii) Write the name of the point where these two lines intersect.
Solution:
(i) The horizontal line: x – axis and the vertical line: y – axis.
(ii) Each part is called “Quadrant”.
(iii) Origin
Example 3.2.b:
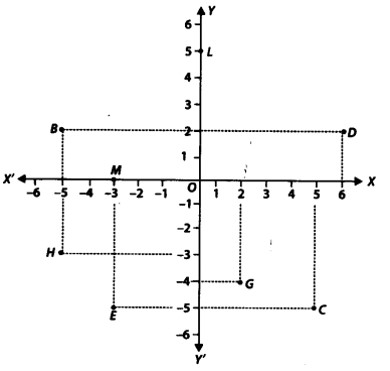
See the given figure and write the following:
(i) The coordinates of B.
(ii) The coordinates of C.
(iii) The point identified by the coordinates (-3,-5).
(iv) The point identified by the coordinates (2,-4).
(v) The abscissa of the point D.
(vi) The ordinate of the point H.
(vii) The coordinates of the point L.
(viii) The coordinates of the point M.
Solution:
From the figure, we have
(i) The coordinates of B are (-5,2).
(ii) The coordinates of C are (5, -5).
(iii) The point E is identified by the coordinates (-3,-5).
(iv) The point G is identified by the coordinates (2,-4).
(v) The abscissa of the point D is 6.
(vi) The ordinate of the point H is -3.
(vii) The coordinates of the point L are (0,5). (viii) The coordinates of the point M are (-3,0).
Example 3.3.a:
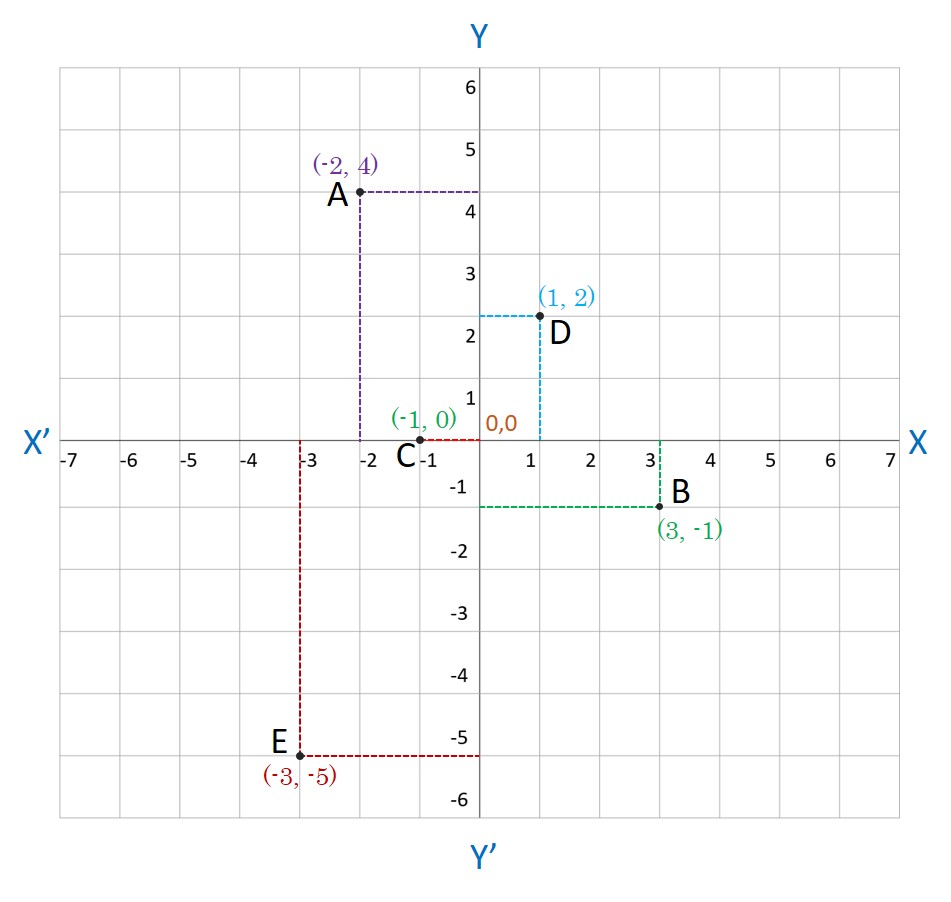
In which quadrant or on which axis do each of the points (-2, 4),(3, -1), (-1, 0),(1, 2) and (-3, -5) lie?
Verify your answer by locating them on the Cartesian plane.
Solution:
The point (-2, 4) is having negative abscissa and positive ordinate.
∴ (-2,4) lies in the 2nd quadrant.
The point (3, -1) is having positive abscissa and negative ordinate.
∴ (3, -1) lies in the 4th quadrant.
The point (-1, 0) is having negative abscissa and zero ordinate.
∴ The point (-1, 0) lies on the negative x-axis.
The point (1, 2) is having the abscissa as well as ordinate positive.
∴ Point (1,2) lies in the 1st quadrant.
The point (-3, -5) is having the abscissa as well as ordinate negative.
∴ Point (-3, -5) lies in the 3rd quadrant.
These points are plotted in the Cartesian plane as shown in the following figure as A(-2, 4); B(3, -1); C(-l, 0); D(l, 2) and E (-3, -5).
Example 3.3.b:
Plot the points (x, y) given in the following table on the plane, choosing suitable units of distance on the axes.

Solution:
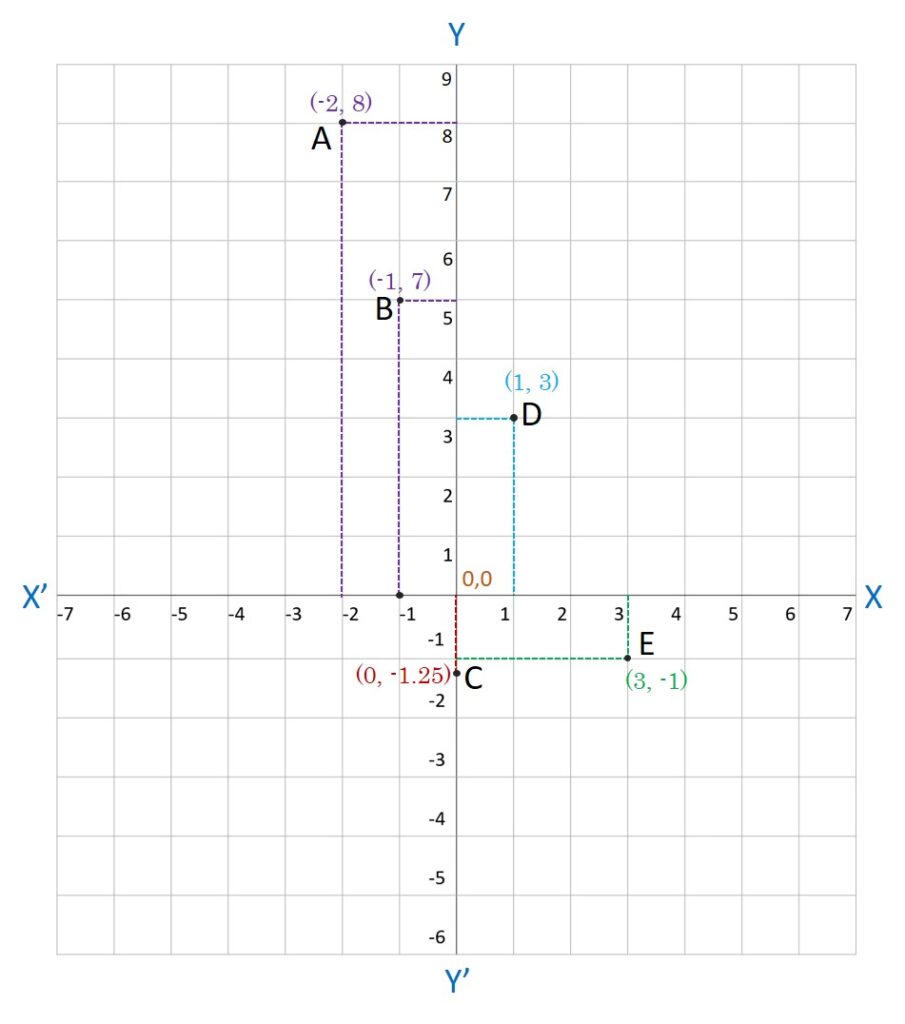
The given points are (-2, 8), (-1, 7), (0, -1.25), (1,3) and (3, -1).
To plot these points:
(i) We draw X’OX and YOY’ as axes.
(ii) We choose suitable units of distance on the axes.
(iii) To plot (-2,8), we start from O, take (-2) units on x-axis and then (+8) units on y – axis. We mark the point as A (-2, 8).
(iv) To plot (-1,7), we start from O, take (-1) units on x-axis and then (+7) units on the y – axis. We mark the point as B(-1, 7).
(v) To plot (0, -1.25), we move along 1.25 units below the x-axis on the y – axis and mark the point as C(0, -1.25).
(vi) To plot (1, 3), we take (+1) unit on the x-axis and then (+3) units on the y – axis. We mark the point as D(1, 3).
(vii) To plot (3, -1), we take (+3) units on the x-axis and then (-1) unit on the y – axis. We mark the point E(3, -1).